Weekly Market Recap · Nov 9–13, 2026
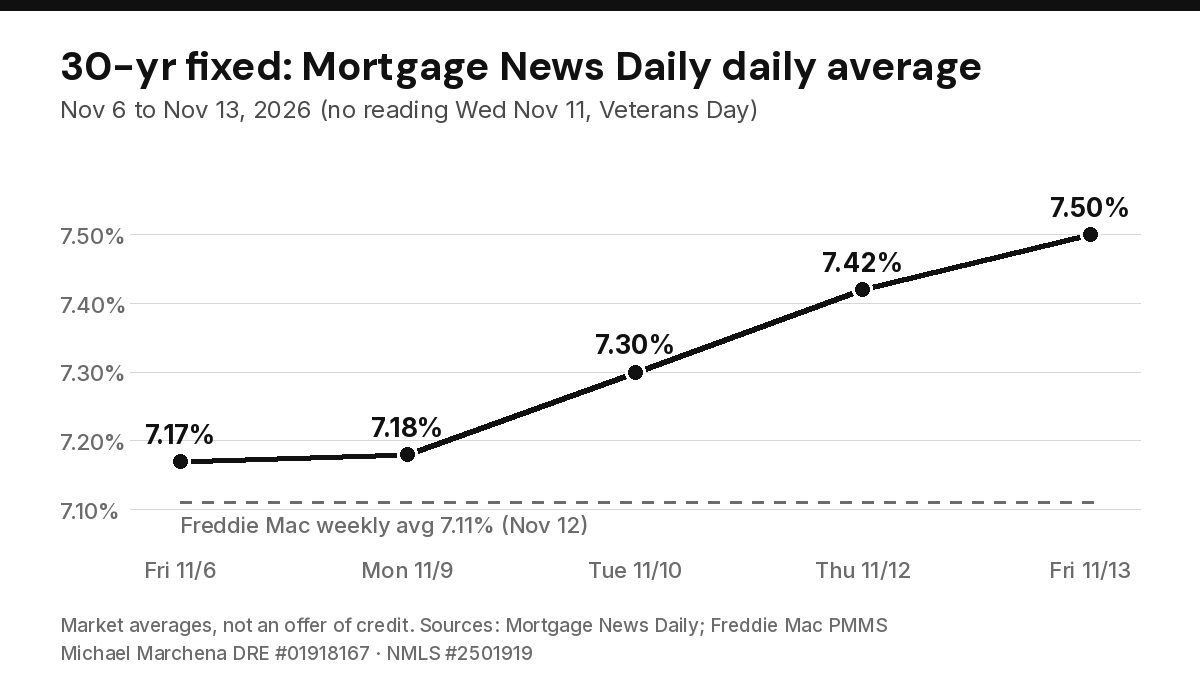
Rates jumped back up to 7.50%
Here is your recap of the week: where mortgage rates jumped from 7.17% to 7.50%, what moved the market, and what the numbers look like for Riverside County and the Inland Empire.
Market averages, not an offer of credit.
30-year fixed average, Mortgage News Daily, Nov 13
30-year fixed, Freddie Mac weekly survey, released Thursday
10-year Treasury yield, up about 0.30 percentage point on the week
Riverside County median single-family price, October, down 1.0% from a year ago (CRMLS)
Rates: most of October’s gains are gone
All rates below are market averages, not an offer of credit.
30-year fixed average, Nov 6–13
The average 30-year fixed rate rose from 7.17% last Friday to 7.50% this Friday, according to Mortgage News Daily’s daily index. Nearly all of that came in three days after Tuesday’s inflation report. Mortgage News Daily said the move erased “a vast majority of the improvement seen over the past 5 weeks.”
Freddie Mac’s weekly survey, released Thursday, showed the 30-year at 7.11% and the 15-year at 6.45%, a fourth straight weekly decline. That survey mostly reflects pricing from earlier in the week, before the jump. A year ago the 30-year was 6.24%.
What moved the market
Inflation
October CPI rose 0.4% (0.3% expected), with core at 0.3%.
Wholesale prices
PPI rose 0.3% for the month and 6.5% from a year ago.
Bonds
The 10-year Treasury yield ended the week near 5.15%, up about 0.30 percentage point on the week.
The Fed
Futures markets now price a 100% chance of a rate hike at the December 8–9 meeting (CME FedWatch, via CNBC). Fed Governor Waller said a larger half-point move should be considered.
National housing
Existing-home sales pace, October
Existing-home sales fell 5.5% in October to a 3.75 million annual pace, the slowest since August 2010. The national median price was $416,700, up 0.4% from a year ago, with 5.1 months of supply.
Redfin reports the median sale price at $388,613 (down 0.9% from last year) and pending sales at a record low, with 21% of listings taking a price cut.
Active inventory vs. a year ago
Realtor.com says new listings dropped 10.3% from a year ago while active inventory rose 8.3%, as homes sit longer.
The California Association of REALTORS® hasn’t released October numbers yet. In September, the statewide median was $899,720 (up 1.7% from a year ago) and sales were down 6.5%.
Home sales vs. a year ago (September)
Statewide median price (September)
Riverside County and the Inland Empire
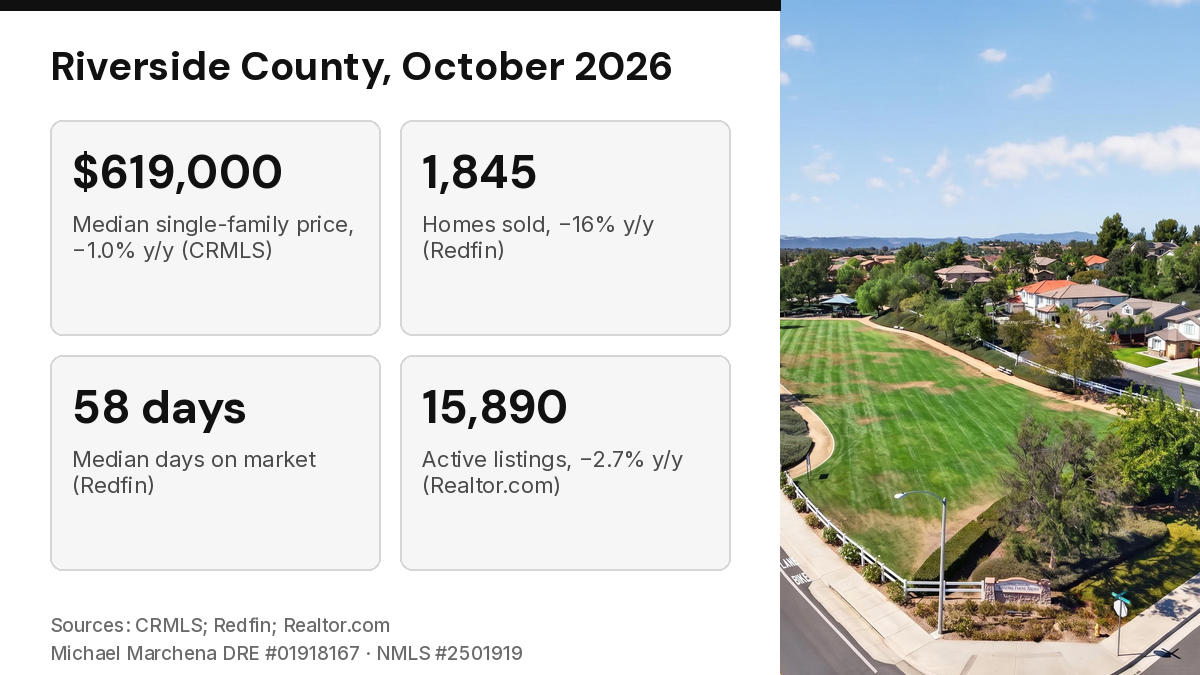
Median single-family price (October)
$619,000, down 1.0% from a year ago (San Bernardino County: $545,000, up 0.2%).
Homes sold in October: 1,845, down 16% from last year; 19.7% of homes had a price drop.
Median 58 days on market.
15,890, about 2.7% fewer than a year ago.
What it means
Buyers have more time and more room to negotiate than in years past, and sellers who price right still sell close to list (98.7% sale-to-list, per Redfin). With rates swinging daily, having your pre-approval and a plan ready lets you act when rates dip.
The week ahead
October retail sales; NAHB builder confidence
Housing starts and permits; pending home sales; minutes from the Fed’s October meeting
Jobless claims; Freddie Mac weekly rates
Fed speakers, including Governors Waller and Cook
Questions about your options?
Call, text or start your application online.
Rates shown are market averages from the sources cited, not an offer of credit or a commitment to lend. Rates and programs change daily and depend on your credit, loan amount and property. This is general market information, not financial advice.
Michael Marchena NMLS #2501919 / CA DRE #01918167 | Perez Consulting Inc. dba Top Loan Fundings NMLS #1943565 / CA DRE #02084080 | Equal Housing Opportunity | NMLS Consumer Access: nmlsconsumeraccess.org
Sources: Mortgage News Daily, Freddie Mac, CNBC (October CPI), CNBC (October PPI), Trading Economics, CNBC (Treasury yields), Saxo, NAR, Redfin, Realtor.com, C.A.R., CRMLS, Redfin (Riverside County), Realtor.com (Riverside County), TD Economics